
 In previous post, I presented the emission of CO2 in Europe, North America and Asia & Oceania based on the data comes from International Energy Agency publication (2017) available here.
Now, I would like to present the emission divided by main economic sectors. The Report’s Authors specified five of them:
1) Electricity and heat production;
2) Other energy including own use
3) Manufacturing industries and construction
4) Transport
5) Other sectors
The recent data comes from 2015 and shows the total emission of CO2 from fuel combustion in millions tonnes and also count per capita. Charts 1-3 present the structure CO2 emissions from fuel combustion in millions tonnes in Europe, North America and Asia & Oceania.
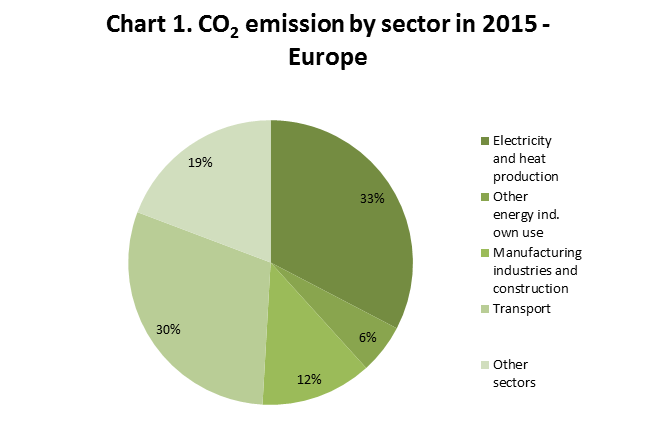
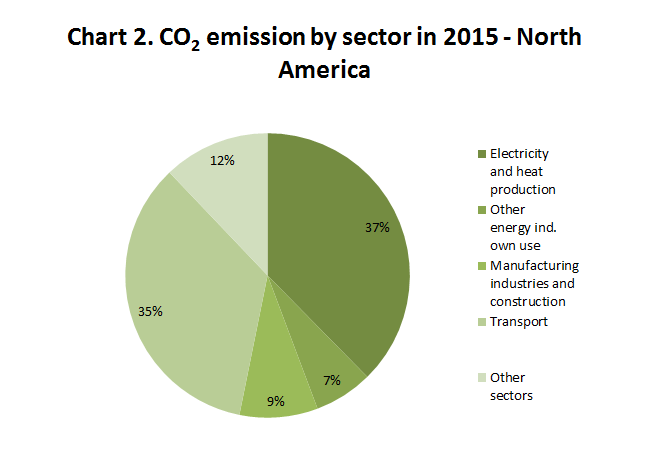
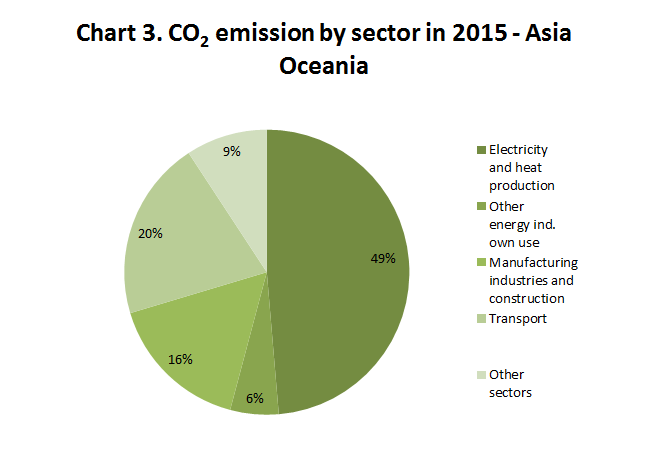
Source: IEA. (2017). CO2 emissions from fuel combustion. Highlights.
The Electricity and heat production and Transport are responsible for the important part of emission. The first mentioned sector is responsible for 33% of emission in Europe, while in Asia and Oceania it is almost a half of emission. North America is not an important ‘producer’ of CO2 by Electricity and heat production sector, but when we combine the level of emission with emission from Transport it is 72% of total emission of CO2 on this continent. Counting in this way, Europe generated 63% and Asia & Oceania – 68%. It is worth to notice that Manufacturing industries and construction sector is responsible only for approx. 13% of total emission (in North America it is 9% and in Asia & Oceania – is 16%).
This article was written within EU project entitled “Using innovation procurement and capacity building to promote circular economy” (Circular PP), supported by the Interreg Baltic Sea Region Programme.
Photo: TresMariasinPie (on flickr.com)